Spatial Statistics Using R
Master Spatial Statistics Using R and learn how to analyze and visualize spatial data for real-world applications in environmental science, urban planning, geography, and beyond. This course provides a hands-on approach to working with geospatial datasets using R.
What You’ll Learn:
Introduction to Spatial Data & GIS in R
Handling Spatial Data (sf, sp, raster, terra)
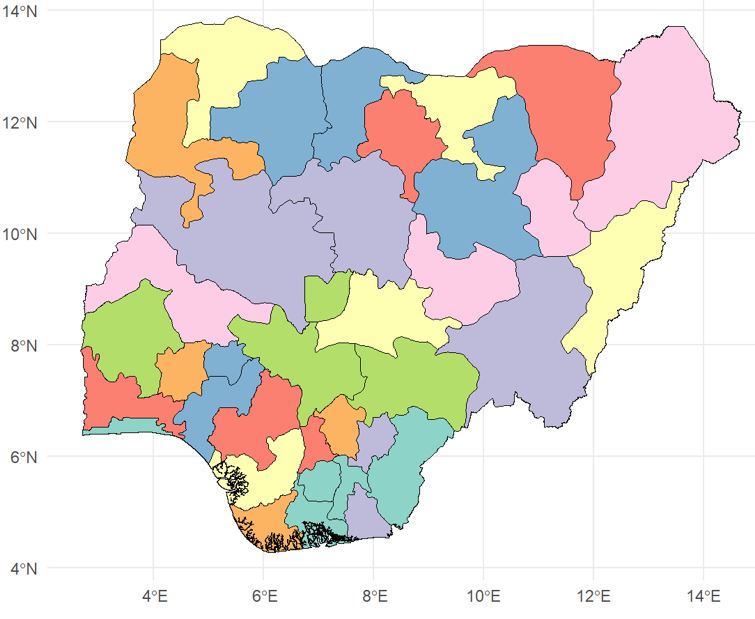
Spatial Data Visualization (ggplot2, tmap, leaflet)
Spatial Interpolation & Kriging (gstat, automap)
Point Pattern Analysis (spatstat)
Geostatistical Modeling
Spatial Regression & Autocorrelation (spdep, GWmodel)
By the end of this course, students will be able to process, analyze, and model spatial data effectively—an essential skill for professionals in environmental research, remote sensing, urban planning, and geostatistics.
🚀 Who Should Enroll?
- GIS analysts & geospatial professionals
- Researchers in environmental & social sciences
- Data scientists interested in spatial analytics
🔗 Enroll Now & Unlock the Power of Spatial Data!
- Teacher: Dr Isaac Ajao